Fig. 2. Comparison of the Pf of each cells line after high glucose hyperosmotic stress for 24 hours. Differential effects of glucose are shown depending on the cell line. **p<0.01 and ***p<0.001 compared to respective control.
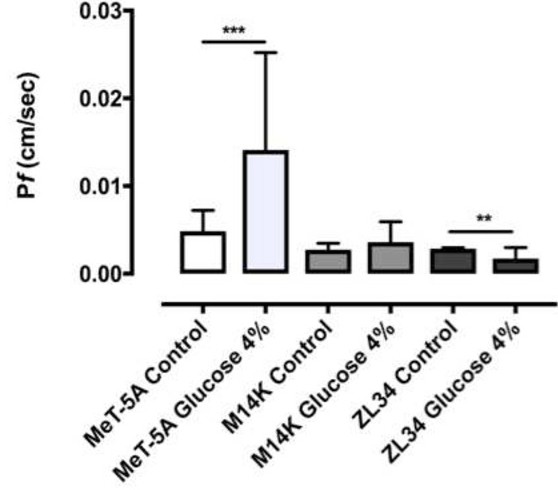
Fig. 2. Comparison of the Pf of each cells line after high glucose hyperosmotic stress for 24 hours. Differential effects of glucose are shown depending on the cell line. **p<0.01 and ***p<0.001 compared to respective control.